
M09 completed the core path with verifiable automation. M10 opens the
optional specializations: the same cantilever-beam family, but with a
more slender variant whose response is no longer linear. You will enable NLGEOM,
solve with substeps, add bilinear plasticity, and compare load–displacement curves using
numerical evidence.
Your mission
You will run three progressive cases—linear, geometrically nonlinear, and elastoplastic—plot the load–response curve, read convergence in the .out file, and document the source of each deviation in CSV.
Guiding question: can you prove when the linear model stops being valid?
Objectives
After completing M10, you will be able to:
- Enable
NLGEOM,ONand solve with progressive ramping (KBC,0,NSUBST). - Define bilinear plasticity with
TB,BISOandTBDATA. - Extract a load–displacement curve from POST1 with
OUTRES,ALL,ALL. - Check convergence (
n_sets = n_substeps) and global equilibrium. - Quantify
geom_dev_ratioandplastic_dev_ratioagainst the baseline. - Distinguish static load factor, substep, and equilibrium iteration.
Prerequisites and downloads
- M07: linear validation with
passes=1. - M06: substeps and the meaning of
TIMEas a load factor. - Optional M07 extension: curve with POST26.
10_start.mac— starting point.10_static_nonlinear.mac— audited deliverable.10_bug_hunt.mac— five faults.10_challenge.mac— verifiable challenge.10_expected_results.csv— numerical contract.load-displacement-linear-vs-nl.svg— curves.convergence-substeps.svg— substeps.
How to use this lesson
| Path | Duration | Coverage |
|---|---|---|
| First win | 20–25 min | Linear baseline + NLGEOM with ramping and first CSV. |
| Complete | 70–75 min | Plasticity, full curve, debugging, challenge, and mastery. |
Session map
- Mission: objectives, downloads, and prediction.
- Mental model: linear versus geometric versus material.
- Demonstration: baseline, NLGEOM, curve, and plasticity.
- Debugging: five common faults.
- Challenge: modify the load and explain the curve.
- Mastery: final M10 test.
Prediction — When does nonlinearity matter?
Slender variant: L = 0.5 m, h = 0.04 m, b = 0.05 m, F = −10000 N, E = 210 GPa.
I = b·h³/12
uy_ref = F·L³/(3·E·I)| Quantity | Value | Interpretation |
|---|---|---|
uy_ref | −7.44047619E−3 m | Euler–Bernoulli reference |
|uy_ref|/h | ≈ 18.6% | Large displacements likely |
Theoretical σ_max | ≈ 450 MPa | Above Sy = 250 MPa → yielding |
| Topology | 312 nodes / 150 elems | Mesh consistent with mesh_h = 0.02 m |
Prediction: with NLGEOM,ON, the final deflection will differ from the linear result by at least 0.05% (a small geometric effect in bending). With plasticity, the deviation will be much larger (~24%).
Mental model — Linear versus nonlinear
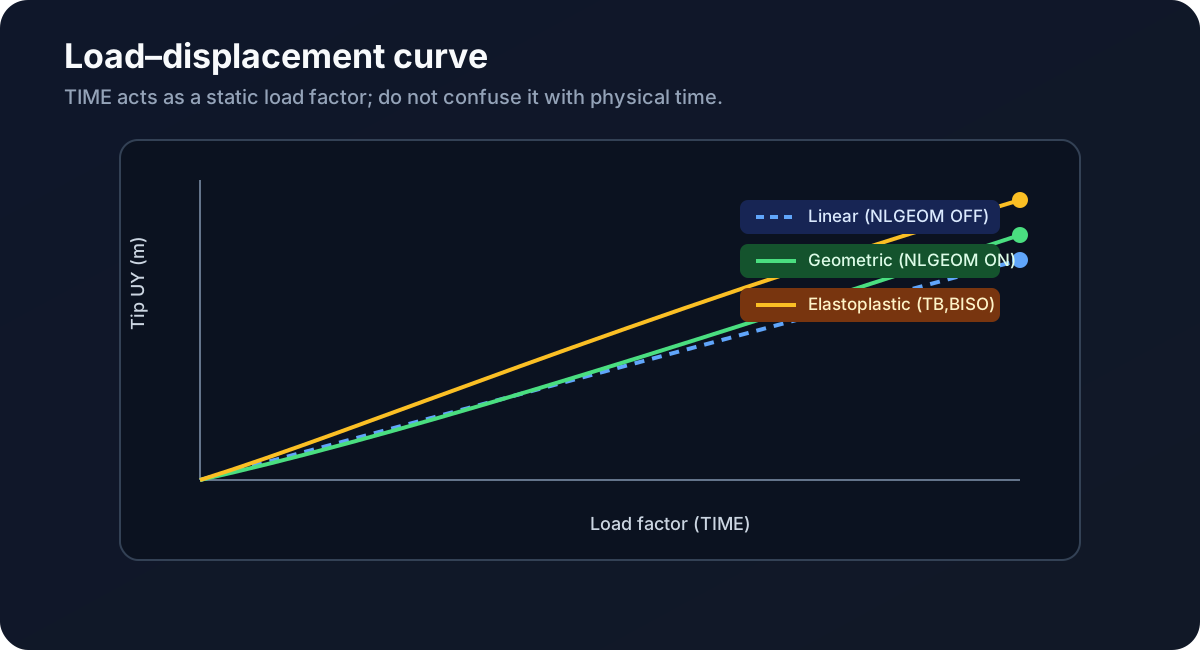
- Geometric:
NLGEOM,ONupdates stiffness with the deformed configuration. - Material:
TB,BISOallows yielding beyond Sy. - Numerical: substeps + iterations; convergence ≠ automatic physical validity.
- TIME: load factor in static analysis; do not confuse it with M14 transient time.
Step 1 — Reproducible linear baseline
/CLEAR,START
/FILNAME,m10_nonlinear,1
/UNITS,SI
beam_l=0.5
beam_h=0.04
tip_force=-10000
...
ANTYPE,STATIC
NLGEOM,OFF
KBC,1
NSUBST,1
OUTRES,ALL,LAST
SOLVE
Check equilibrium (force_error and moment_error < 0.5%), topology 312/150, and uy_linear close to uy_ref.
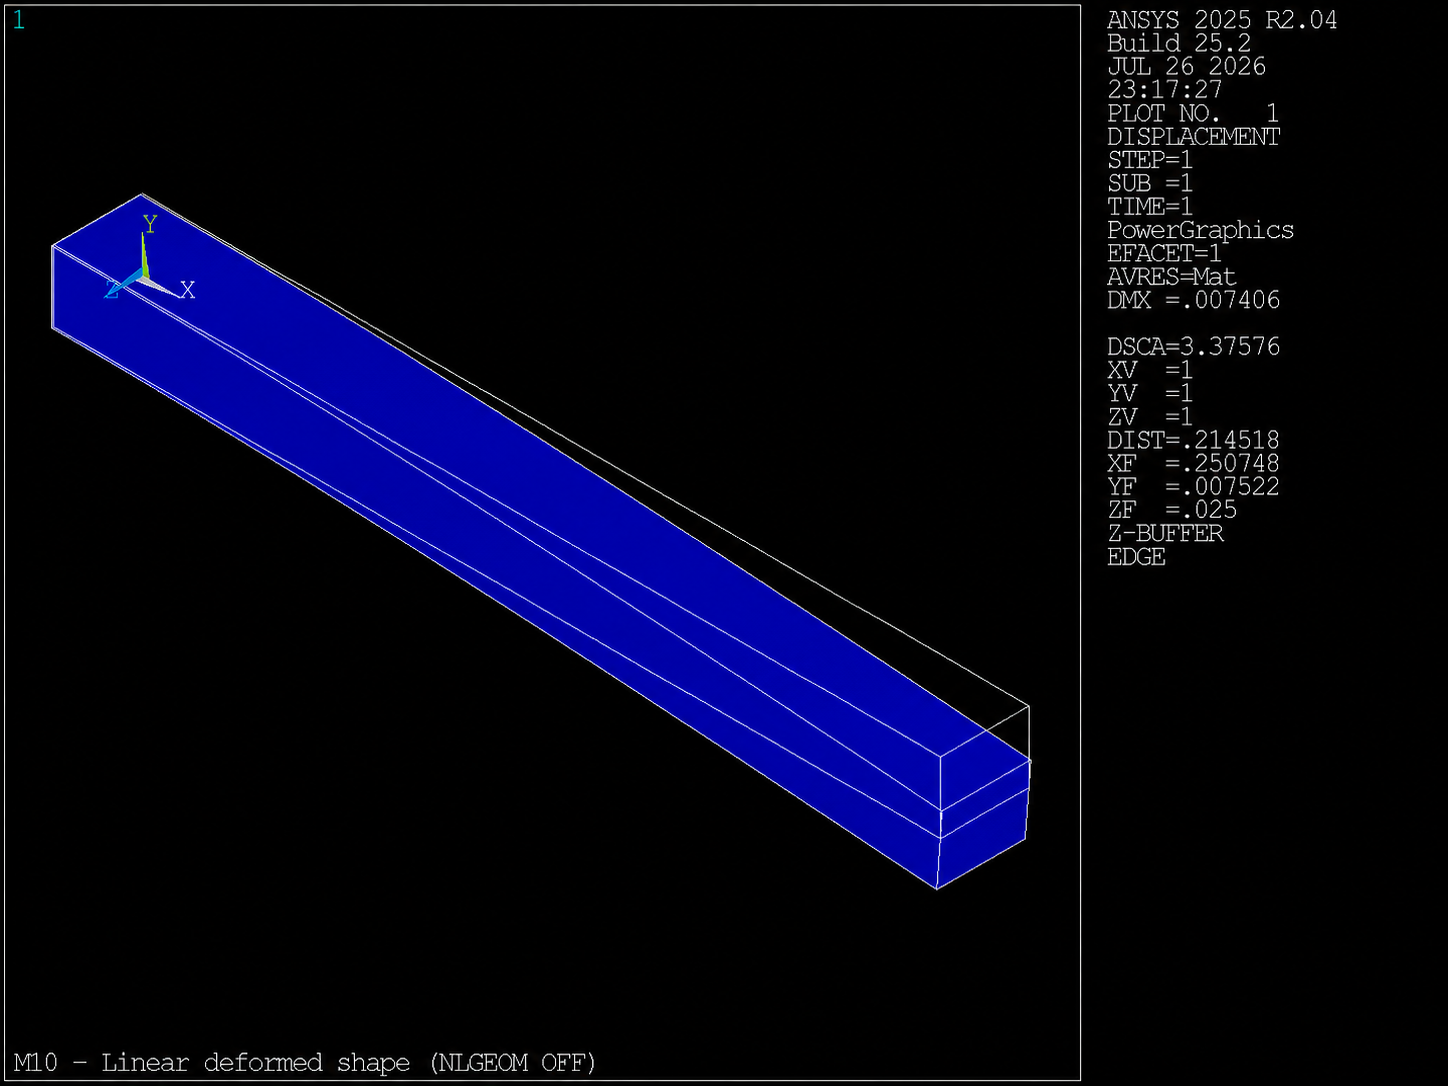
NLGEOM OFF). Slender geometry L=0.5 m.Step 2 — Enable NLGEOM and substeps
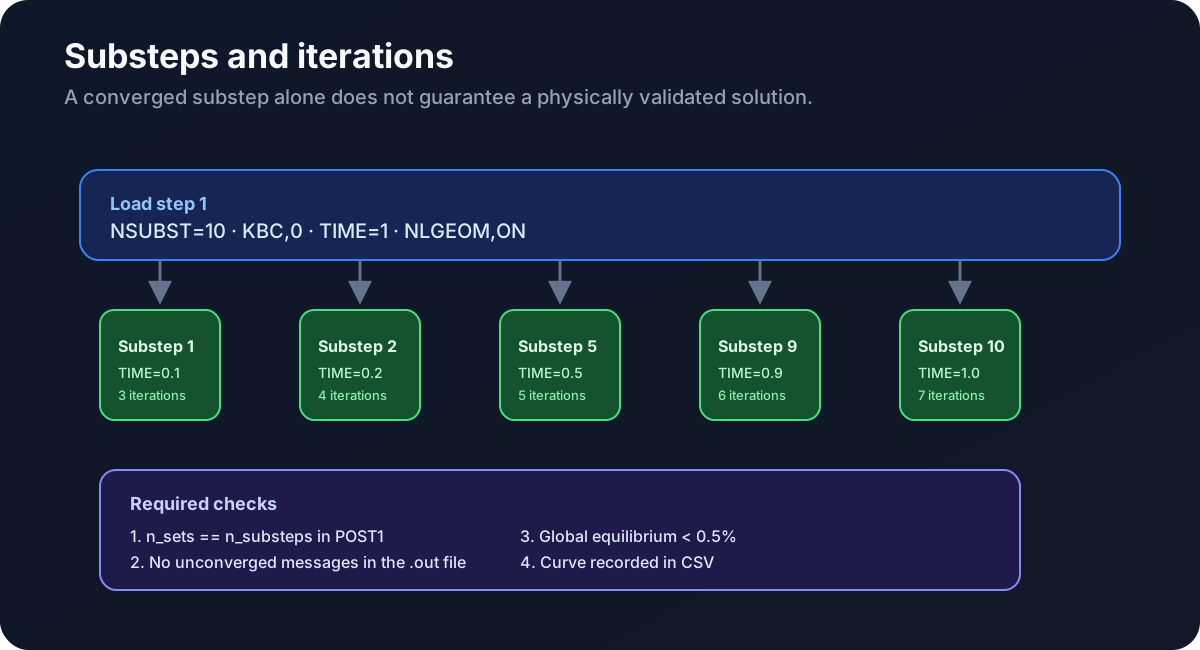
ANTYPE,STATIC
NLGEOM,ON
KBC,0
NSUBST,10,10,10
NEQIT,50
OUTRES,ALL,ALL
TIME,1
SOLVE
After solving, verify in POST1: *GET,n_sets,ACTIVE,0,SET,NSET must equal 10. Look in the .out file for completed convergence messages without aborts.
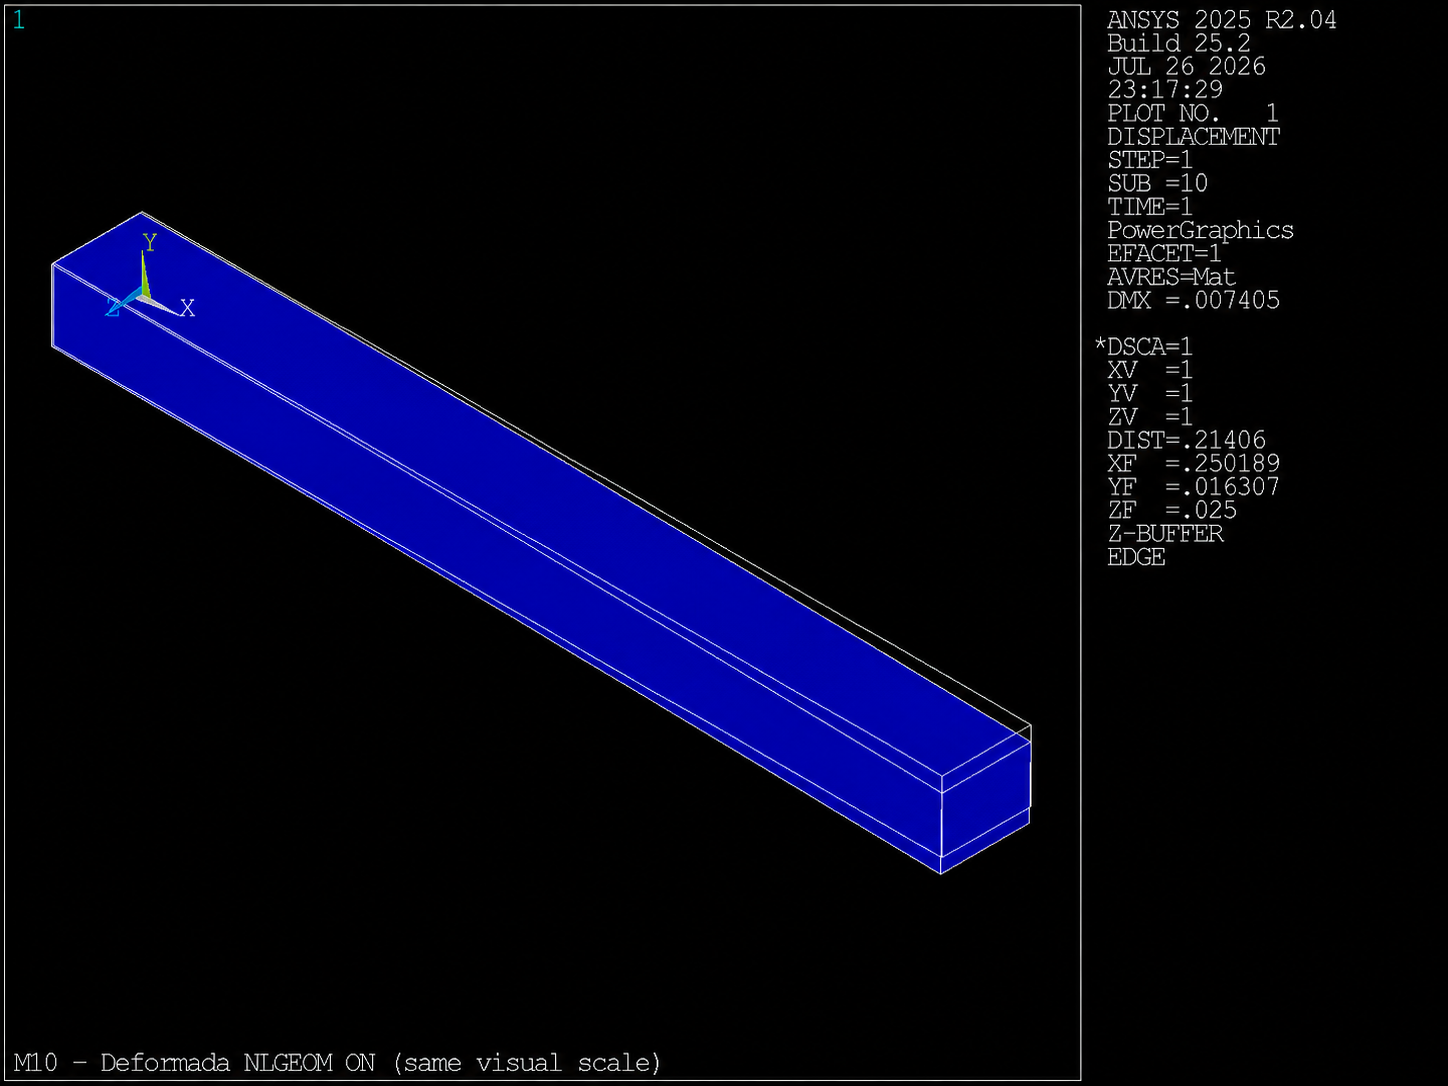
NLGEOM ON deformed shape (same load). Compare it with the preceding figure, not only with the CSV.Step 3 — Load–displacement curve
/POST1
*DO,i,1,n_sets_geom
  SET,1,1,,,i
  *GET,load_factor,ACTIVE,0,SET,TIME
  *GET,uy_step,NODE,corner_node,U,Y
  ! write row to m10_load_curve.csv
*ENDDO
Calculate geom_dev_ratio = |uy_geom − uy_linear| / |uy_linear|. It must be ≥ 0.05%. Plasticity must produce plastic_dev_ratio ≥ 5% relative to the elastic geometric case.
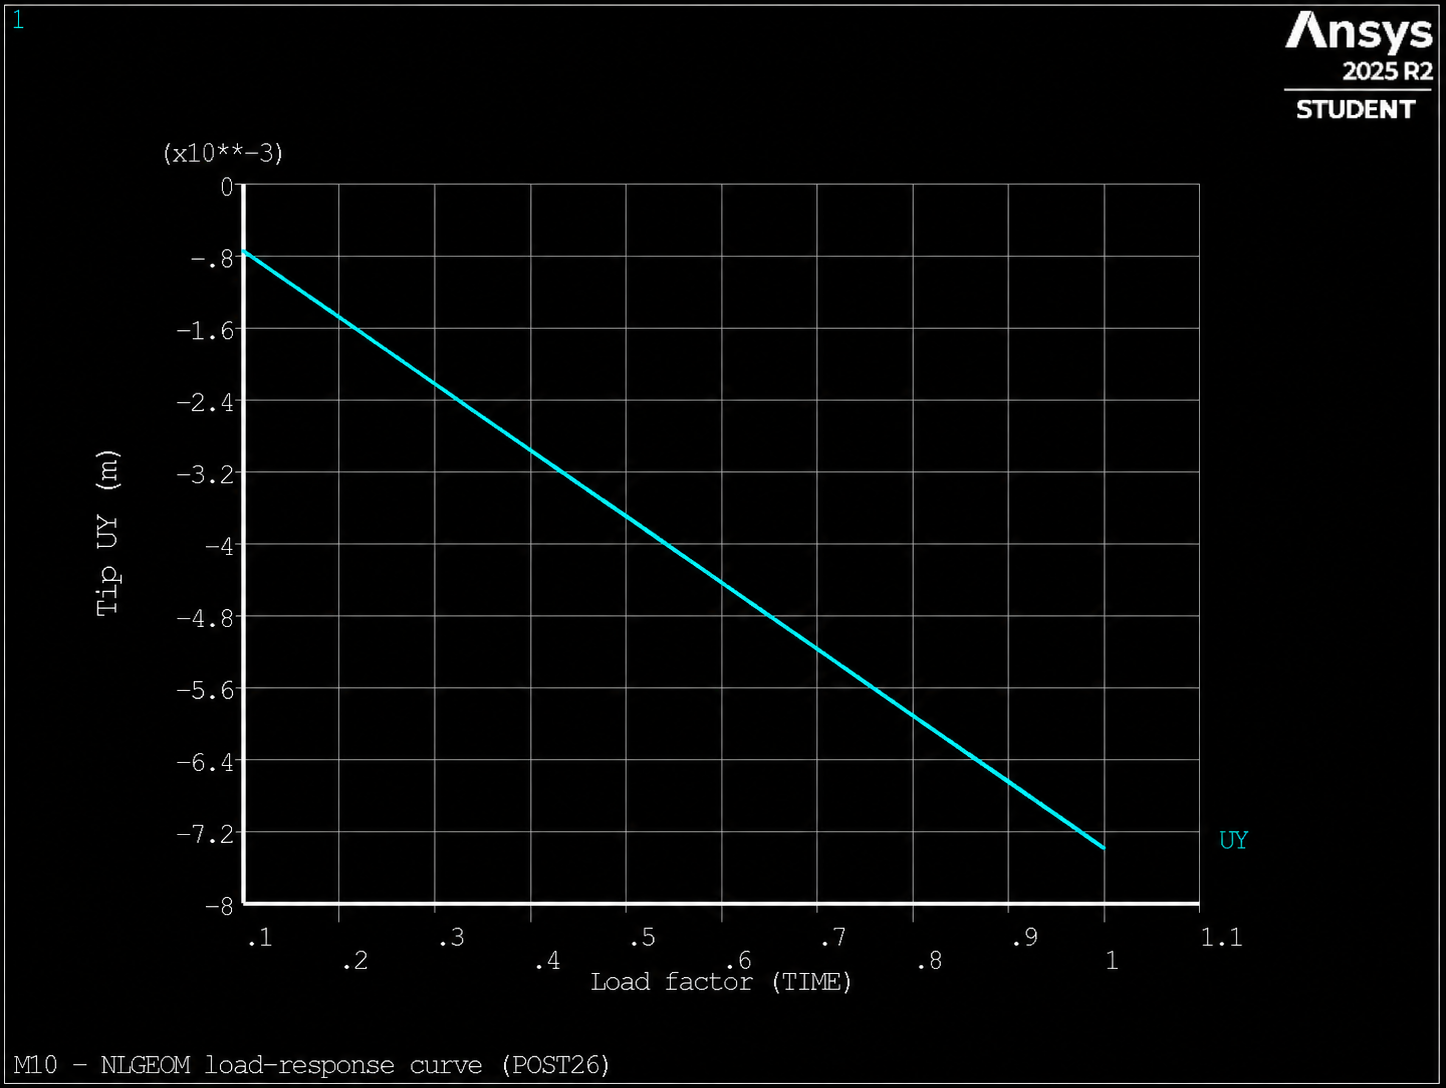
NLGEOM branch (POST26). All three complete branches are in m10_load_curve.csv.Step 4 — Controlled plasticity
TB,BISO,1,1
TBDATA,1,250E6,0    ! Sy = 250 MPa, tangent = 0 (perfectly plastic)
Repeat the ramp with NLGEOM,ON. Compare uy_plastic against uy_geom: plastic_dev_ratio must be ≥ 5%. Document whether yielding amplifies deflection beyond the geometric effect alone.
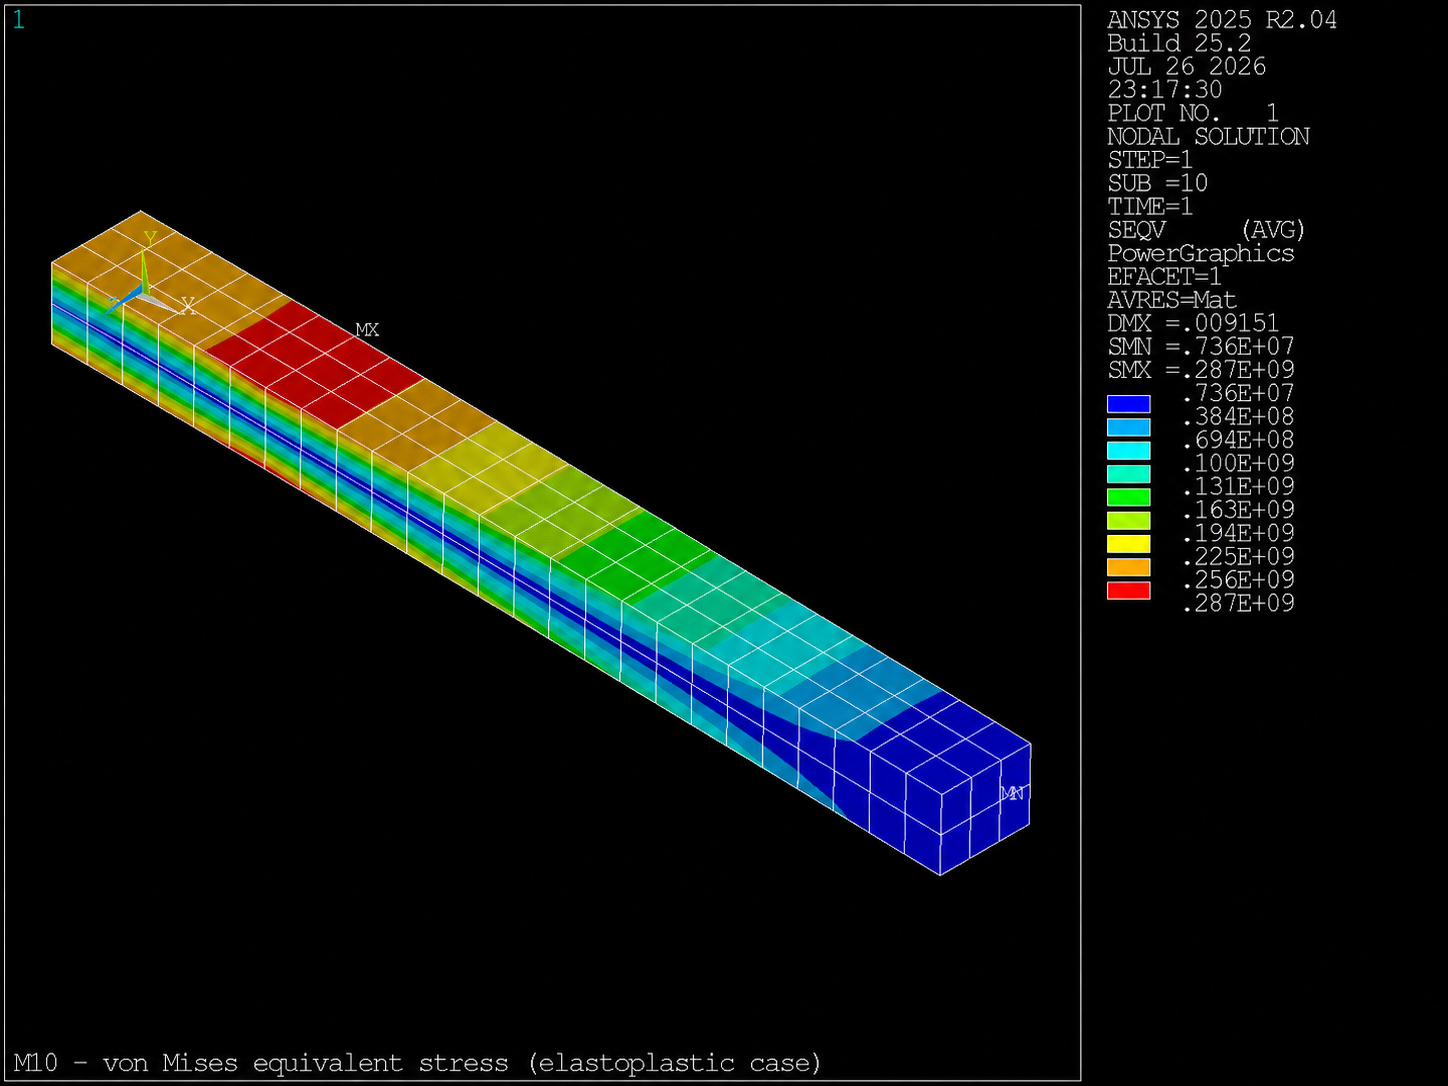
PLNSOL,S,EQV).Step 5 — Read convergence in .out
Minimum checks before accepting results:
n_converged = n_substepsin POST1.- No unresolved “Solution not converged” lines.
- Global equilibrium < 0.5% in all three cases.
- Curve with 10 points in
m10_load_curve.csv.
Bug hunt
| # | Fault | Symptom | Correction |
|---|---|---|---|
| 1 | NLGEOM,OFF | Curve matches linear case | NLGEOM,ON |
| 2 | No TB,BISO | Plastic = geometric | Define table and TBDATA |
| 3 | NSUBST,1 | Does not converge or underestimates | Ramp with 10 substeps |
| 4 | OUTRES,LAST | Only one set | OUTRES,ALL,ALL |
| 5 | Not reading .out | False passes=1 | Verify n_sets |
Verifiable challenge
Change tip_force=-12000 N while keeping the geometry. Predict whether geom_dev_ratio increases. Run from two clean directories and document uy_linear, uy_geom, and the physical explanation (greater load → greater geometric deviation and potentially earlier yielding).
uy_ref = -8.92857143E-3 m (F = -12000 N)Self-assessment
What does TIME represent in a static ramp?
The load factor applied in that substep, not physical transient time.
Does convergence imply a physically valid solution?
Not necessarily. You must still check equilibrium, boundary conditions, a reasonable deformed shape, and comparison with the baseline.
Why use OUTRES,ALL,ALL with a ramp?
Because OUTRES,LAST discards intermediate substeps needed for the load–displacement curve.
When should TB,BISO be enabled?
When stress exceeds Sy and you need to capture yielding in addition to NLGEOM.
Learning evidence
m10_nonlinear_audit.csv— three cases withpasses=1.m10_load_curve.csv— 10 points from the geometric case.m10_summary.csv— ratios andstudy_passes=1.- Excerpt from the
.outfile showing substep convergence. - Brief note explaining the source of
geom_dev_ratioandplastic_dev_ratio.
Exit checklist
- Linear baseline with equilibrium < 0.5%.
- NLGEOM ON with
n_sets = 10. geom_dev_ratio≥ 0.05%.- Plasticity with
plastic_dev_ratio≥ 5%. - Challenge with F = −12000 N documented.
study_passes=1in a clean run.
Technical traceability
Commands: NLGEOM, TB,BISO, TBDATA, NSUBST, NEQIT, KBC, OUTRES, SET, *GET. References: Structural Analysis Guide; Material Reference. Inherited from: M07 (KEYOPT(2)=3, equilibrium). Next: M11 contact.