
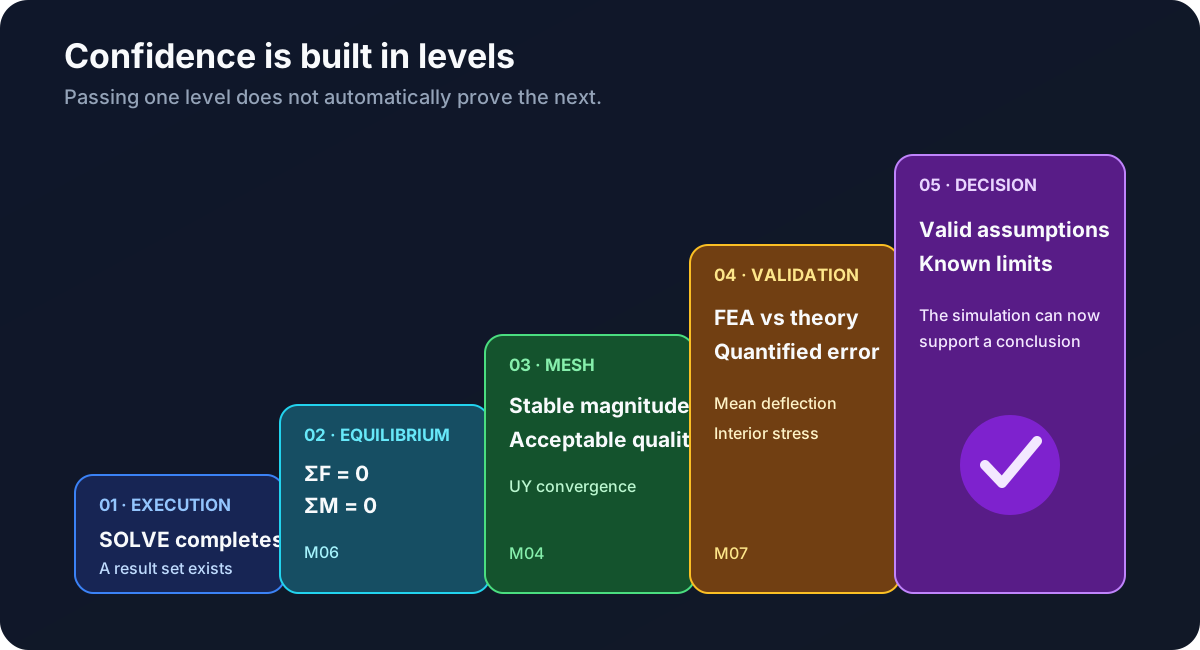
In M06 we showed that the beam was in equilibrium. That still does not answer the more important question: Does it correctly represent the structure we intended to study? In M07 we will turn contour plots into comparable quantities and defensible decisions.
Your mission
You will measure the average deflection of the tip face, extract the normal stress at an interior section, and compare both quantities with beam theory. The resulting CSV will record whether the model passes or fails the validation criteria.
Guiding question: Does a visually reasonable contour constitute validation?
Objectives
By completing M07 you will be able to:
- Distinguish visualization, extraction and validation.
- Deliberately select the result set and coordinate system.
- Extract results using
*GETwithout depending on IDs. - Represent a section using an average and a spread.
- Compare the FEA deflection with Euler–Bernoulli.
- Compare
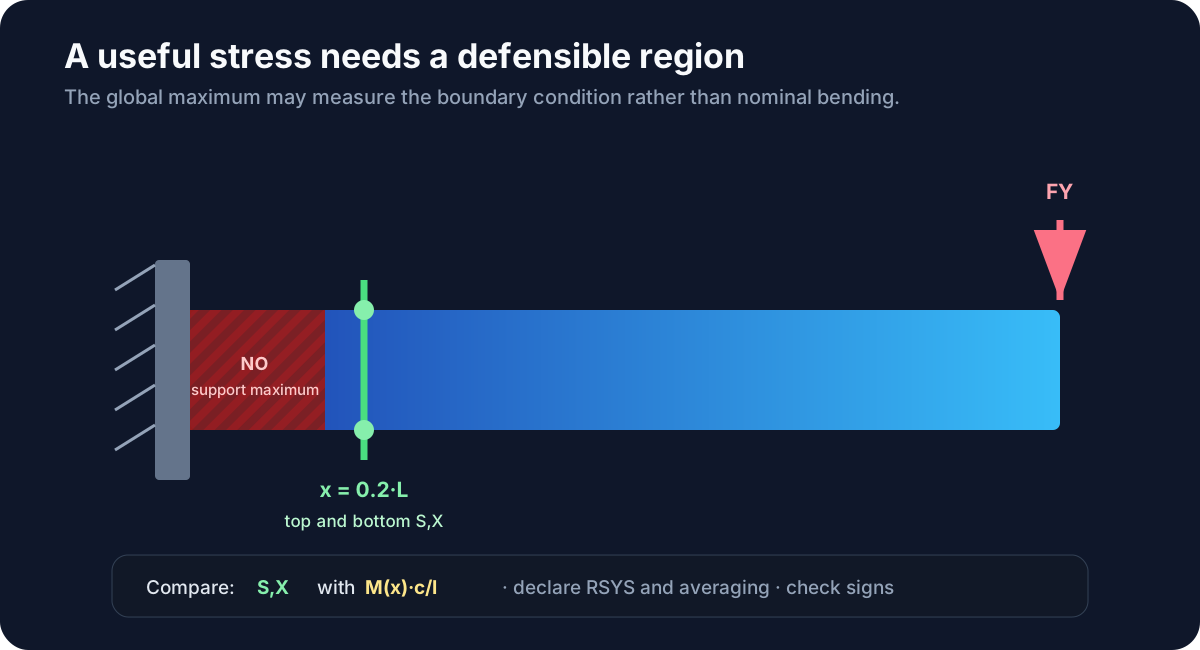
S,Xwith normal bending stress. - Distinguish averaged and non-averaged results.
- Prevent a singularity from governing a global conclusion.
Prerequisites and downloads
- M04: The 40-element mesh is converged for tip displacement.
- M06: a set exists and the balance of forces and moments is closed.
- M01: the analytical expressions for deflection and nominal stress are available.
07_start.mac— starting point.07_post_validation.mac— audited solution.07_bug_hunt.mac— five misleading validation approaches.07_challenge.mac— scaling challenge.07_expected_results.csv— self-checking contract.07_graphics_post26.mac— extension: PNG output and a load–response curve.07_graphics_challenge.mac— constant slope challenge.07_graphics_expected_results.csv— expansion contract.validation-ladder.svg— trust ladder.stress-probe-vs-singularity.svg— stress section.
How to use this lesson
| Track | Duration | Scope |
|---|---|---|
| Quick win | 35–40 min | Prediction, deformation inspection and mean deflection extraction. |
| Complete | 70–75 min | Additionally, interior stress validation, balance, scaling challenge and CSV. |
| Graphic expansion (optional) | 25–30 min | Reproducible PNG plots, the m07_load_response.csv table, and a first curve with /POST26. |
Keep visualization, extraction, and validation separate. A plausible contour plot is no substitute for comparison with an analytical reference and a justified tolerance.
Session map
- Mission: goals, downloads and analytical prediction.
- Mental model: trust ladder, not a single verdict.
- Demo: deflection, interior stress, and preserved equilibrium.
- Bug hunting: singularities and wrong magnitudes.
- Challenge: double the length with verifiable reasons.
- Extension (optional): Reproducible graphs and load–response curve with POST26.
- Mastery: final test that records demonstrated mastery and recommends M08.